

Leave a Comment:
(1) comment
Add Your Reply
 Random Thoughts
I’ve caught some flak lately for being prudent. Yes, the Ps (S&P 500) and Quack (Nasdaq) have had impressive rallies but you can’t take indices at face value. You have to dig a little deeper to see what’s really going on. This can be accomplished using market indicators such as the advance/decline line, percent of stocks above their 200-day moving averages, and so forth. Although these do have their purposes, I just prefer to get my hands dirty by looking under the hood.
If a stock is trending, by law it has to be making new highs. So, the first thing I do is take a look at all of the stocks within my tradable universe-average volume greater than 250k—that are hitting new highs. The number of stocks in the list and the makeup of the stocks in the list can be telling. If there are only a few stocks in the list and they are mostly defensive issues or bond related then the market may be entering a cautious phase. Looking to the recent new high list (11/11/15), the top stocks in the list were mostly bond ETFs, foods, and a few big cap stocks. This, as opposed to numerous more speculative issues, tells me that the market may be in a defensive mode and that the leadership may be narrow.

On The Go? Listen To This Column
And, Several Thousand Others
 I then dive in by looking at nearly all 2-3 thousand stocks in my tradable universe. This is work but for me it’s like being on a daily treasure hunt. Keep in mind that I’m not obsessing over each and every chart. At a blink of an eye, I can see what stocks are trending and which ones are not. If I do find something interesting, I flag it for further analysis and move on. By rough estimates, I’ve probably looked at over 15 million charts over the last 20-something years.
If want to become better as a musician, practice. If you want to become better as a technician, then look at charts, lots of charts. Maybe you came out of the womb being able to read charts. For the 99.99% of the rest of us, talent is made, not born. I have to work my ass off. Books have been written on this–the talent thing, not my fat ass. Gladwell’s are my favorites.
Looking at charts, lots of charts, really gives you a feel for what’s actually happening. Ask yourself: Are stocks mostly headed higher? Lower? Or, just plain sideways? Where are the setups? Are there few or many? Are they mostly shorts or longs? Are most stocks trading cleanly or do most look like an electrocardiogram? Are there any “debacle de jours”—i.e. stocks that were torpedoed? Just look at what’s actually there.
Right now my empirical research is showing that most stocks other than the aforementioned bond related funds and selected big cap issues are in downtrends, or at the least, have stalled well short of new highs. There’s quite a few debacle de jours and a plethora of electrocardiograms.
To The Sectors
Once I get a good feel for things by going through a few thousand stocks, I then turn my focus on the sectors by looking at around 250 sectors/sector ETFs. Right now, many such as Drugs, Health Services, Transports, and Retail have stalled well short of their old highs in their retrace rallies. And, most of those that did make it to new highs such as Tobacco, Aerospace/Defense, and Hardware have subsequently come back in.
And Last, But Not Least, The Indices
 After the sector analysis, I turn my focus to the indices, looking for signs and signals. The S&P 500 has recently had a sharp retrace rally of nearly 12% in just over 1-month. This is nothing to sneeze at but in markets, as Janet Jackson says, it’s “What have you don’t for me lately?” And, lately the market is stalling near its prior highs, suggesting that it might be finally catching up to what I’ve been seeing internally. Those who failed to sell on the last rally will be forced to rethink things should the recent pullback become more than just that. That’s just human nature.
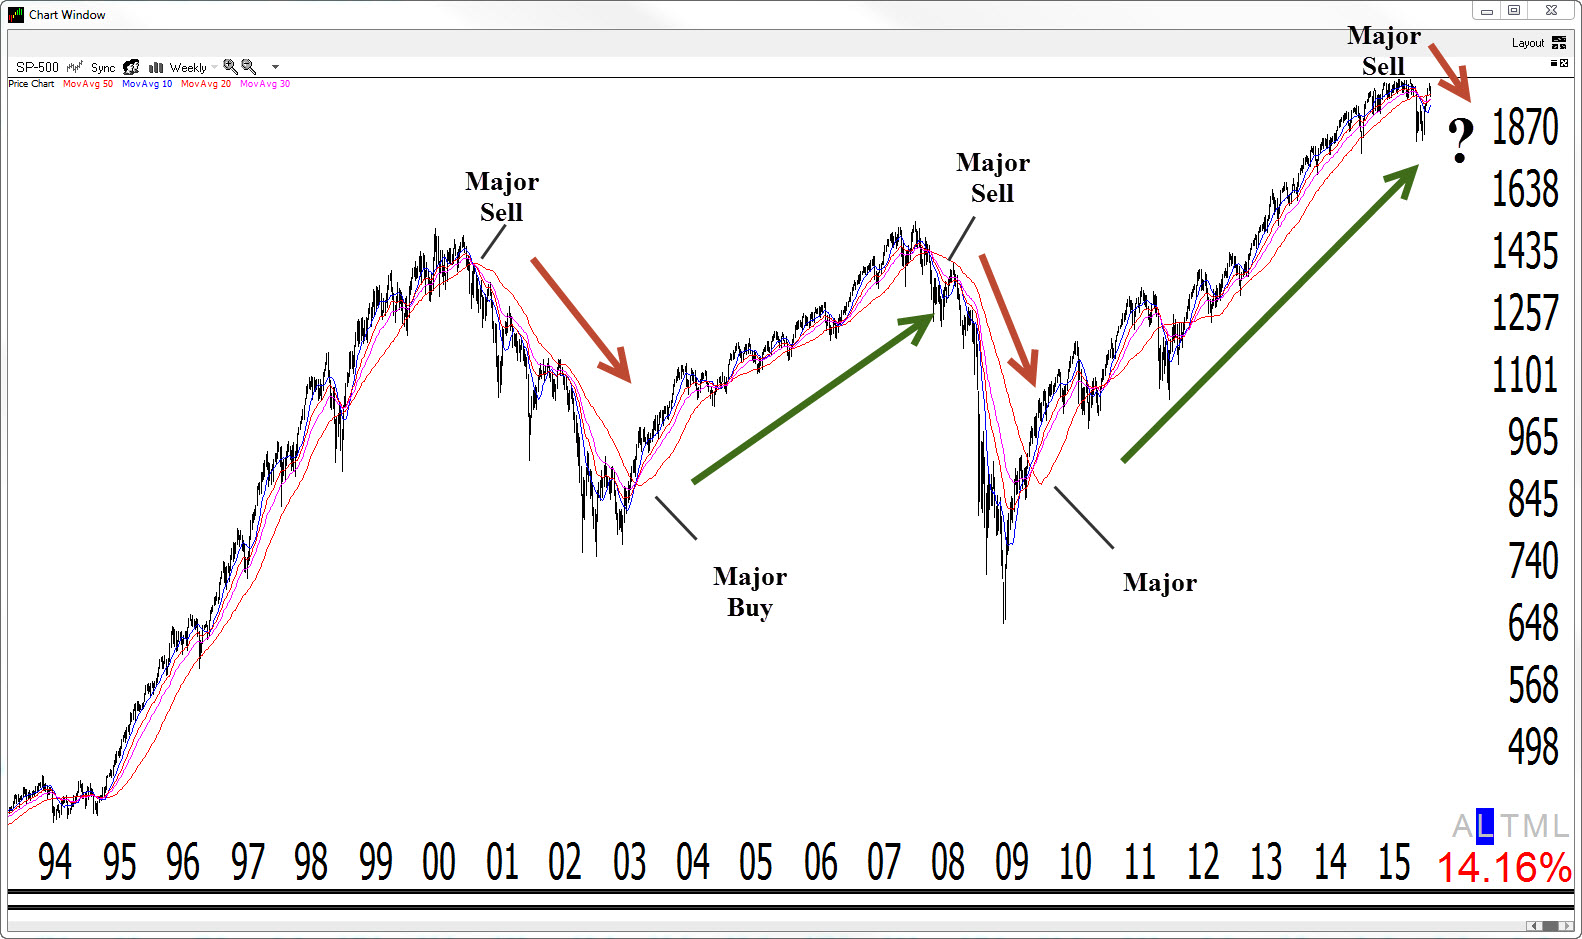
There was also a recent Bowtie sell signal on the weekly chart. This is where three moving averages (10 simple, 20 EMA, & 30 EMA)

Redd Foxx as Fred Sanford, Source: Youtube, original source: NBC
converge and spread out in the opposite direction over a short period of time, giving the appearance of a bow tie. As my good friend Greg Morris once said, (Investing With The Trend) “We treat all signals as if it will turn into the big one.” And, I fully agree. All tops will have signals but not all signals will turn into tops.
Weekly Bowties off of major highs should not be taken lightly. The last 2 times this occurred in the S&P (2000 & 2008) the market subsequently dropped well over 40%. This might not be the “big one Elizabeth” but the fact the stalling action is confirmed by most stocks and sectors, you might want to pay attention.
As mentioned in my last column, if you don’t have time to sift through a few thousand stocks or can’t afford to have me to it for you-BTW, free with purchase–I’ll do it for you for a year, no charge, just purchase the Stock Selection Course between now and midnight today–then look no further than the Rusty (IWM). It hasn’t made much progress in the last couple of months–or years for that matter. It lost nearly 2% on Thursday. This is more indicative of what I’m seeing internally.
I did a walk through on all of the above in yesterday’s Dave Landry’s The Week In Charts. Watch it below. It’s free and must be good because people often say “Dave’s good for nothing!”
So What Do We Do?
Click “2” below to continue reading….
Free Articles, Videos, Webinars, and more....