

Menu
by Dave Landry
When multiple moving averages cross over a short period of time, it suggests that trend has turned on both shorter-term and longer-term cycles. You then wait for the setup-in my case a pullback—to enter. For the moving averages, I like to use a 10-period simple, a 20-period exponential, and a 30-period exponential. I have dubbed this setup a “Bowtie” because when they come together and then spread out it gives the appearance of a bow tie. See the free reports on my website for more on this pattern and setup.
The pattern occurs in all-time frames from the intra-day chart all the way up to the monthly and beyond. Obviously, the longer the time frame, the more significant the signal. Although I trade mostly off the daily chart, I like to watch for weekly Bowties to gauge the overall market. This pattern can help to keep you on the right side of a market, especially after significant highs and lows. This is because the most amount of people are trapped on the wrong side of the market when the trend turns. Signals that occur after multi-year or ideally all-time highs, are the most powerful.
Looking to the Hang Seng, notice that it has recently formed a weekly Bowtie down off of major—8-year—highs. The market lost nearly 60% of its value after the last major sell signal—of off all-time highs—back in 2008.
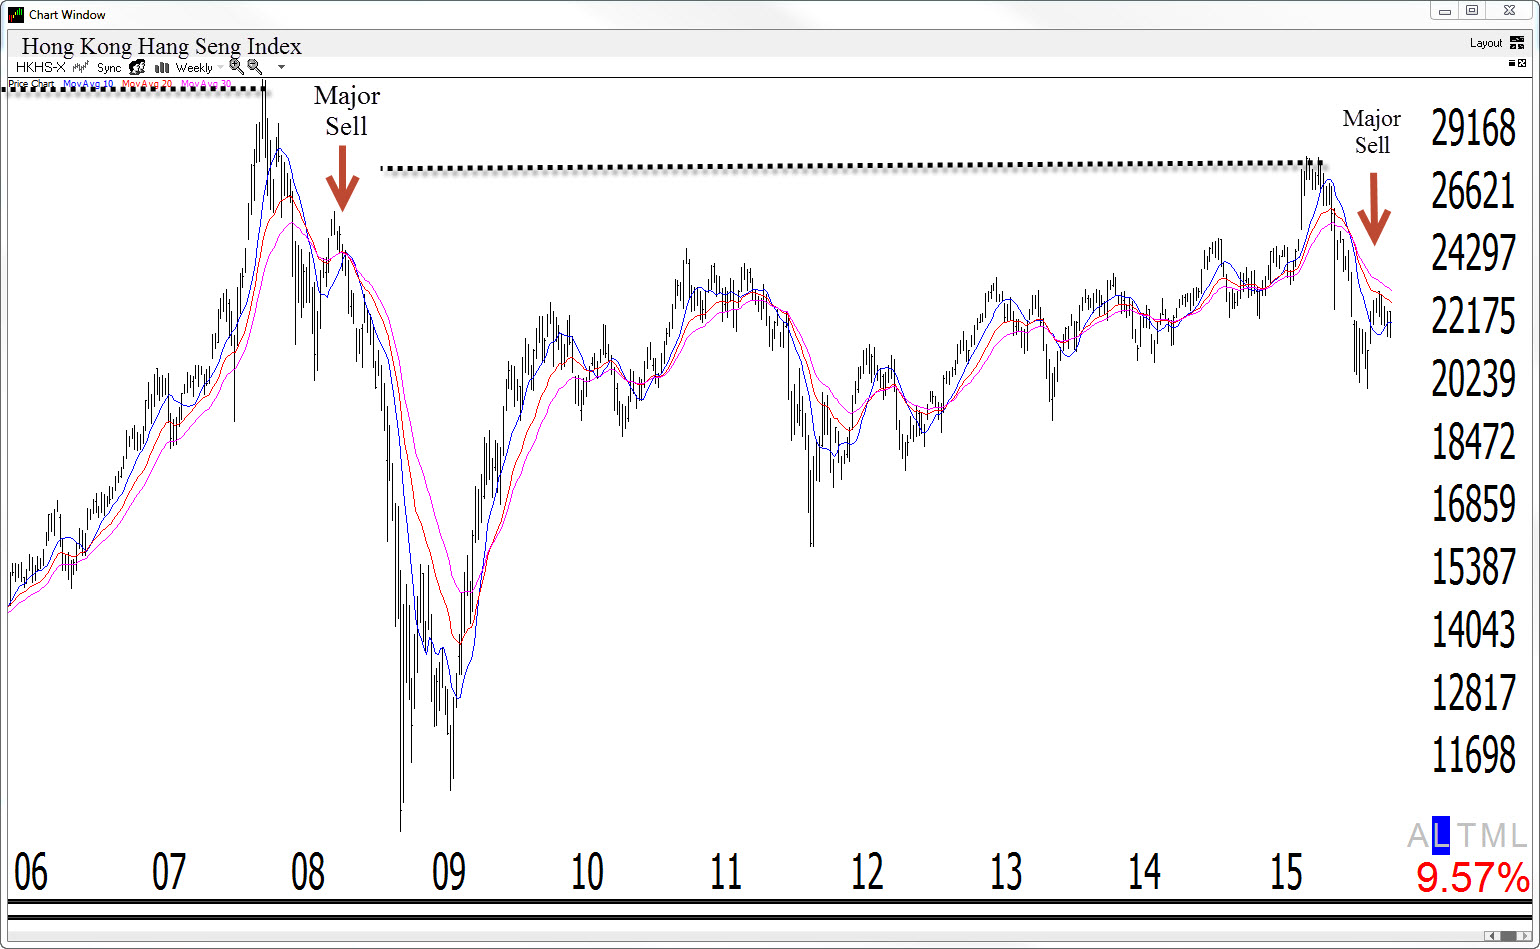
Not all Bowties (or other emerging trend patterns) will turn into major tops but all tops will have signals. Therefore, it pays to pay attention.
Looking forward to seeing you soon!
Dave