
Why Following The Trading Plan Is Hard And Six Steps That You Can Take To Make That Easier
By Dave Landry | Random Thoughts
Random Thoughts
by Dave Landry
Trading is hard. Done right, it will force you to do a lot of unnatural things, and it will make you feel uneasy. Embracing this from both a physiological and a psychological aspect is key. Let’s explore this further, focusing on what happens in your brain before and during the trade.
why trading psychology?
The best methodology in the world is useless without the proper mindset to follow it. Everyone’s a “setup junkie,” especially early in your trading career-guilty as charged. The real secret is not in some secret setup. The real secret is just finding something simple and following it. If you can do that, then read no further. My work is done…dropping the mic as I leave the stage…
The Follow Part Is Hard

I’ve never stressed much in finding setups. True, it took me a while (okay, a little longer than a while) to learn how to draw arrows and pick the best and leave the rest. And, it used to be difficult to occasionally walk away with nothing to show for several hours of research. Again, though, the analysis and planning part never seemed that hard. It’s fun and like being on a treasure hunt. Conversely, execution is tough – still is!

The more I learn about the human brain physiology and psychology, the easier it becomes when I feel uneasy. And, more importantly, I now realize that these feelings are perfectly natural and unavoidable. Trading is a lonely sport. You often wonder if it is just you with these feelings. As Dickson Watts once said, “In his secret heart, every man thinks that the universe is especially hard on him.” The deeper I get into trading psychology, the more I realize that I’m not alone- and neither are you. Channeling Douglas, “The more we understand about the interacting forces behind our behavior and the interacting environmental forces outside of us, the easier it is to fulfill our needs and achieve our goals.”
The Tough Part

Brett Steenbarger, Source: http://traderfeed.blogspot.com/
One of my recent epiphanies came from Brett Steenbarger. He said: “People lose money in the markets because the person who places the trade very often is not the same person who manages and closes the trade. Quite literally, another self has taken over—another mind.” This makes so much sense.
During the planning phase, things are static. Stress is much less when information is known and unchanging. Our analytical “left” brain is mostly in charge. However, the right-brain intuition is still important. With a modicum of experience, the best setups tend to “jump out at you.” When that does occur, you have time to “send it over to the left brain for confirmation.” (Curtis Faith) Hence, planning becomes a whole-brain activity.
old brain, new brain, left brain, right brain
"Wonderful as is the development of the human brain, it originated as an enlarged ganglion, and its first response is still practically that of the ganglion." G.C. Selden circa 1912

I’m not a neuroscientist, and I don’t even play one on TV. I have stayed in a Holiday Inn Express or two, though. All kidding aside, I have learned that our brains have older primal parts, often called our "lizard brain," where our autonomy and emotions derive. The "newer parts" make us conscience-rational beings (or at least some of us). Although neuroscientists may debate some of the exact functionality and connectivity, they tend to agree on the general function of the old brain deep within and the "new" left and right parts that sit on top.

Again, most of the planning phase is done by the logical, less emotional, left brain. Now, since we can’t make any decisions without emotions*, the rest of the brain comes into play.
Once the market opens, things change quickly. The individual parts of your brain tend to take over. The decisions become more emotionally charged, deriving mostly from your right brain and your lizard brain. Below, I’ve listed some of the feelings you'll likely encounter before, and then subsequently during the trade. You’re more logical and less emotional going into the trade than you will be once in the trade.
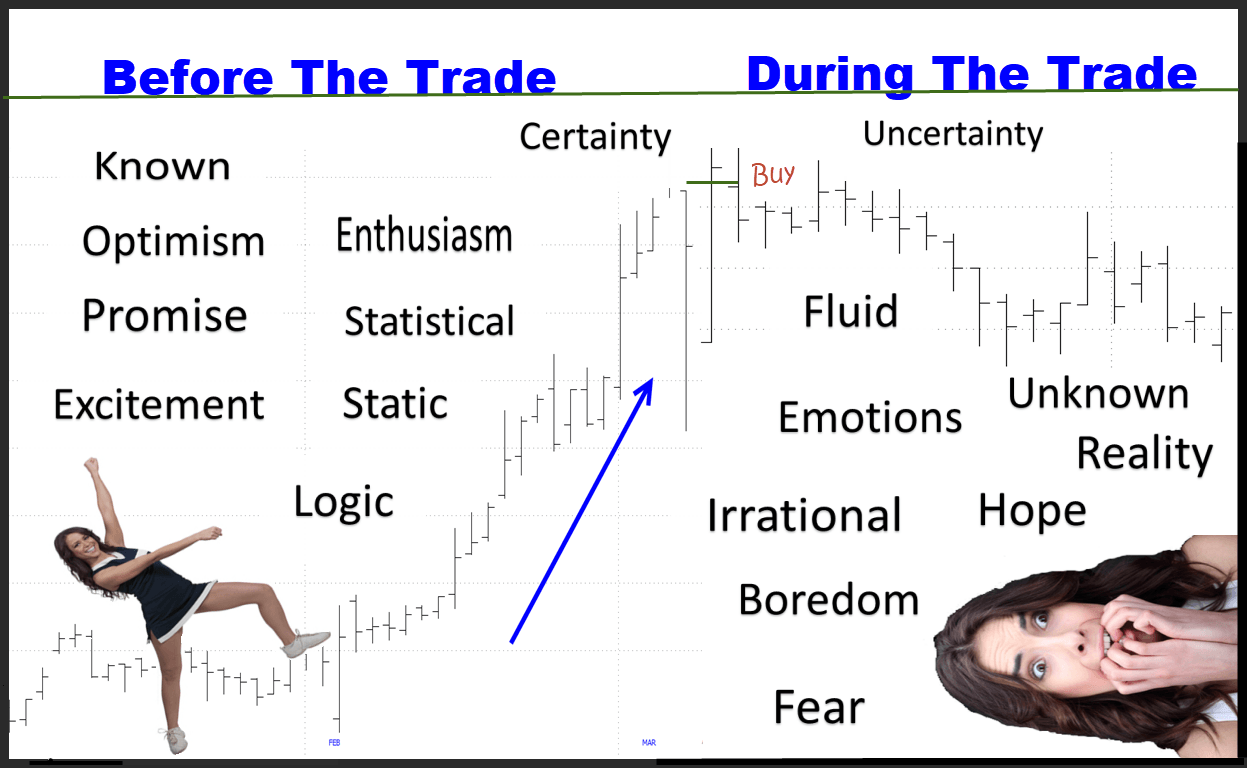
Your Trading Brain: An Owner’s Manual
Recognizing a problem is the first step towards solving it. Accepting that your “pre-trade brain” is much different than your “in trade brain” is key. Now, once that sinks in, take these simple steps:
1. Garbage In, Garbage Out: Maybe one day I’ll write a column without saying that. Today is not the “one day.” Seriously, unless you think you have the mother-of-all setups, then pass. As I preach, practice deliberate practice in your stock picking. Recognizing greatness will breed more greatness. If you’re identifying more and more big winners, then at least you know you have the skills. Then, “all you have to do” now is follow your plan.
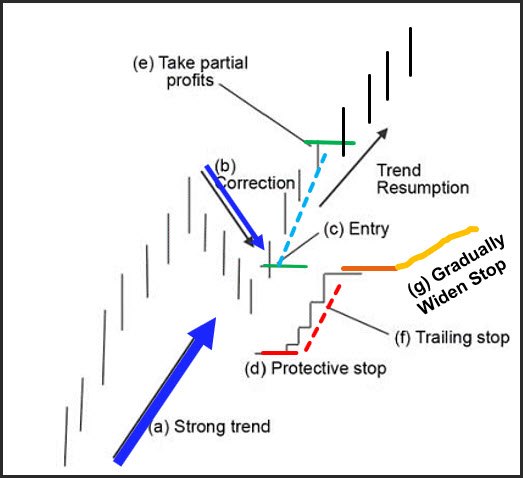
2. Plan Your Trade: Carefully plan while things are static. Take your time and use your whole brain. The more planning you do, the less stress you will have during the trade. People ask me all the time what they should do with a trade. That should have been determined long before the trade was entered. When you boil it down, it’s just an entry, a stop, and an initial profit target. Let's break it down.
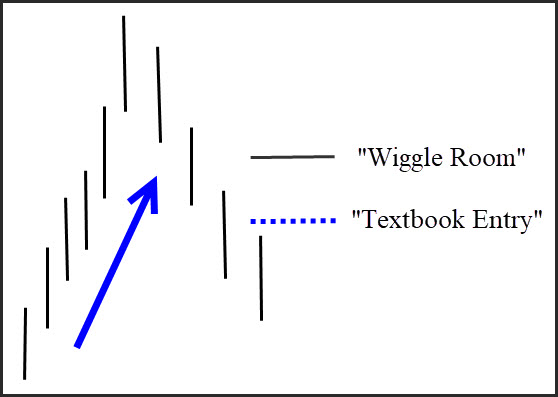
a. The Entry: Unless a stock closes poorly (e.g., Textbook TKOs), make sure there is a little "wiggle room" above the high to help avoid being triggered in on a false move. Yes, I still get tricked on occasion, but I’m amazed at how many losing trades this simple technique will help you to avoid (note: in more recent years I have given stocks more wiggle room on the entry, and this seems to have kept me out of more and more losing trades).

b. The Stop: Once triggered, the stop should be outside of normal volatility or at a place where the position would obviously be a failure. Once you have determined your entry and stop, the initial profit target is simply mathematics: the entry + (entry – stop).
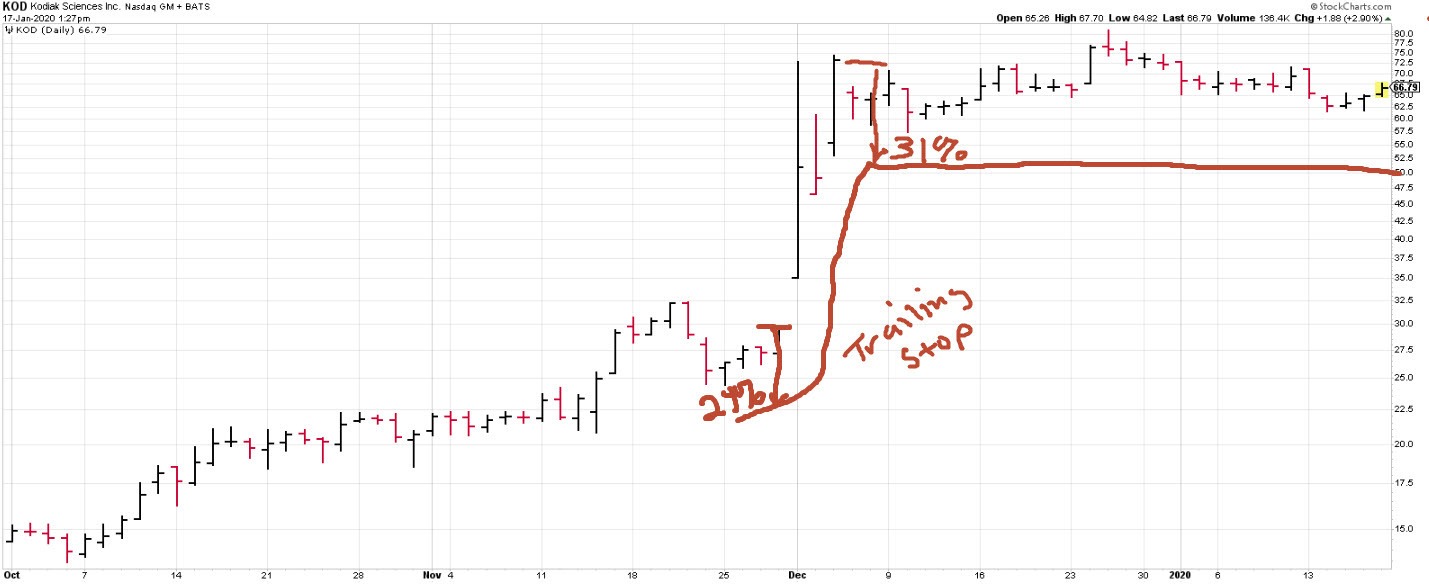
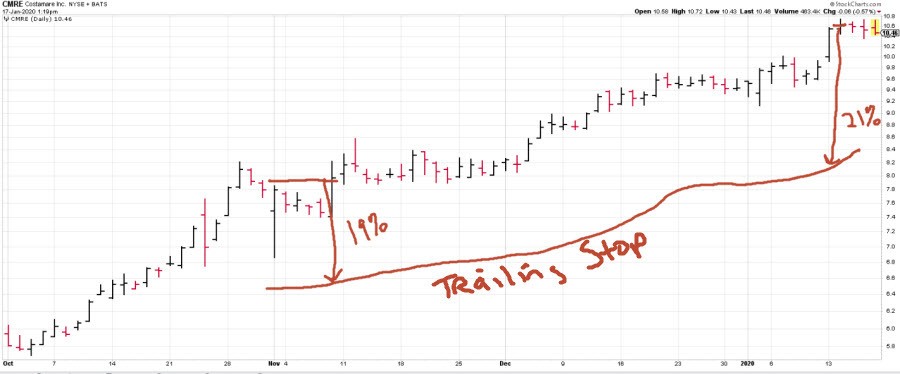
c. The Trailing Stop: On favorable moves, the management of the trade becomes trailing the stop on somewhat of a 1-for-1 basis and taking partial profits if blessed. Then, the trailing stop is gradually loosened to transition to longer-term trend following.
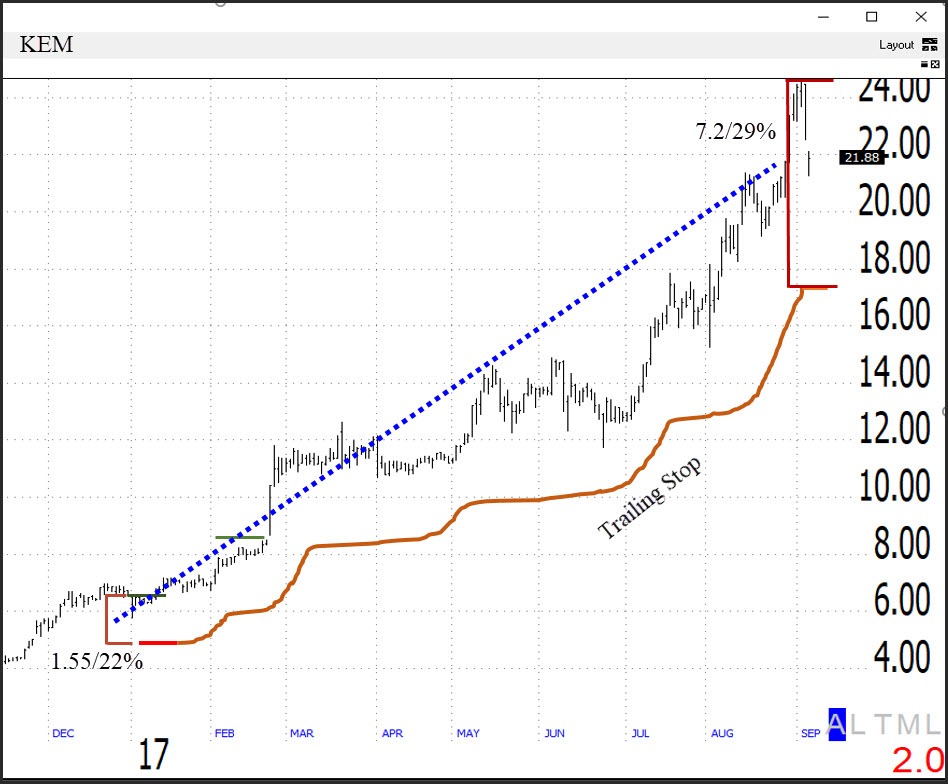
Below are two more trades. Notice the stops have widened in point distance and percentage-wise.
Below is the rest of the model portfolio (note: this article was originally published in 2017 and re-published in 2020). Notice that on most of the trades that have hit the initial profit target (those in white), the remaining shares have looser stops (if hit) (b) than the original stop (a) distance.
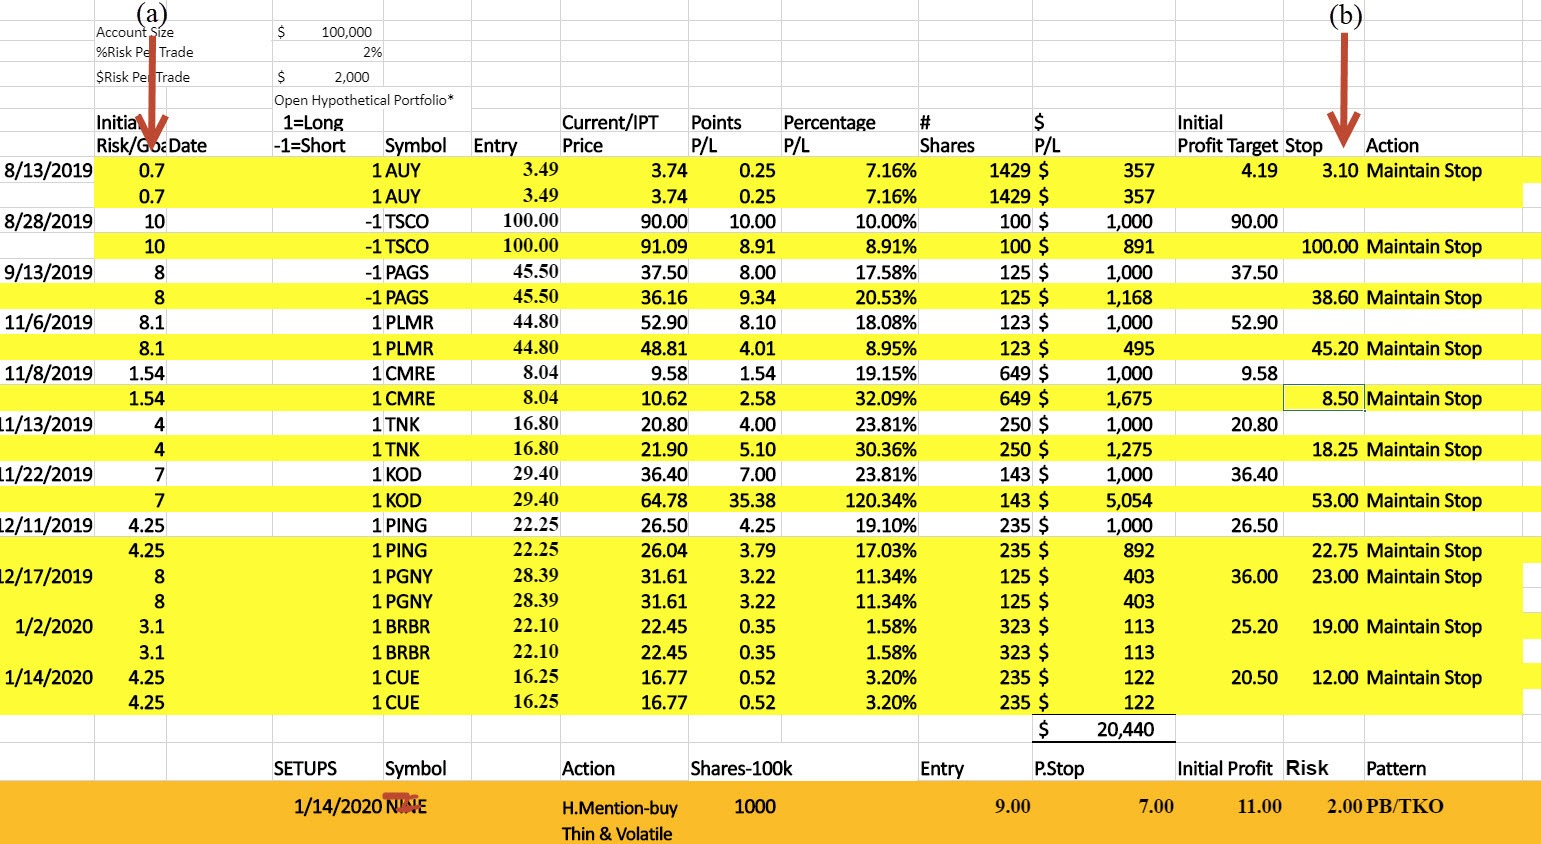
Yes, there are a few more details that I have outlined in the Member's Area (smells like soft selling, see below for a free intro course and market timing course), but you get the gist. It's just a few questions that you have to ask: Where will you enter? Where will you place your stop? Take partial profits? And then, how will you trail your stop? That's it!
3. Just Do It-Flex That Decision Muscle: I once asked a hedge fund manager I was consulting with for a reference. Since I got the new gig, I was curious about what he said. "The truth!," he said, "You’ll always know where you stand with Dave. He might not be right, but he’ll give you a definitive opinion and back it up with his reasoning." He nailed it. As I’ve written before, I’m “often wrong but never in doubt”-and you should be too!
You get better at making decisions by making decisions. You have to get the reps in. Be decisive. Yes, you will occasionally be wrong, but keep taking your best shot. When you don’t know what to do, simply say, “Self, I don’t know what to do, but if I DID know what to do, this is what I would do.” That statement has gotten me through my adult life. It scares me a bit, but so far, so good!
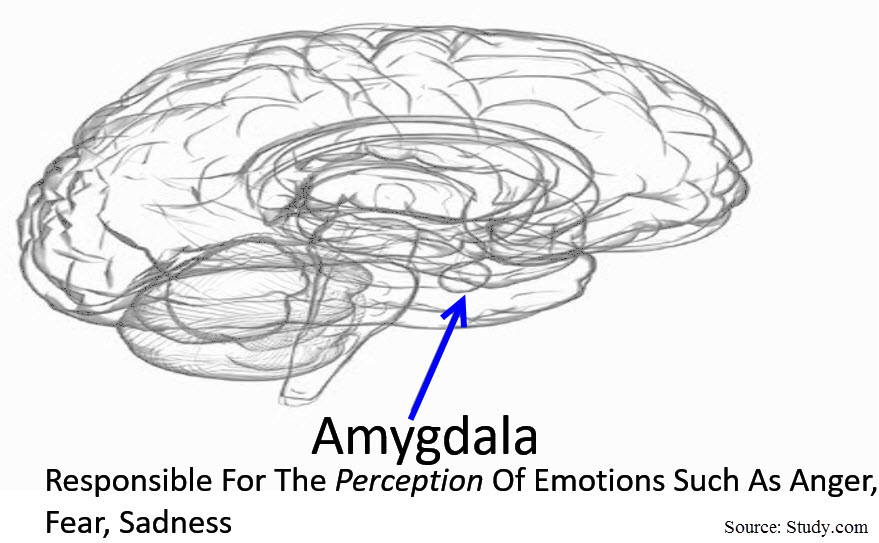

4. Breathe: Your brain’s amygdala may be small in size, but it’s big on emotions. It acts extremely fast to keep you alive in life-threatening situations. Without it, you'd be dead in a day. However, when in a trade, it can be your own worst enemy. You have to learn to “tiptoe past the panic monster.” When you feel tempted to take unnecessary action, don’t! Take a breath instead.

Get good at this exercise by practicing it in life. The next time you feel like snapping at your spouse/significant other (and, I'm not judging, but if you have both, you might have a little too much going on for trading), take a breath. You’re welcome! Sometimes, all that’s needed is a few seconds to bypass the lizard brain to get to the rest of what’s sloshing around up there.

5. Get Your Action Elsewhere: As I preach, trading, done properly, can be quite boring. Doing nothing when there’s nothing to do isn’t easy, especially for people like you who are educated and hard workers. The markets are an expensive place to look for entertainment. If you want action, have an affair. That way, you’ll only lose half of your money. Seriously, following the plan is key. And now, we know why it is so darn hard to follow the plan-so we embrace and accept this.

6. “Be As Close To The Market As You Need To Be But No Closer”
Although execution is tough mentally, it doesn’t have to be. More often than not, there's nothing to do. During these times, unnecessary observations create temptations. Write that down. And, the more that you’re tempted, the more likely you’ll be to take unnecessary action. That’s one of the few things that I can guarantee. That goes for life too. I love beer (so much so that I have a microbrewery in the garage-note, since sold in a move), but I’m dieting. I doubt very seriously that I could go to Oktoberfest and say: “No thanks, I’m just looking.”

Seykota once equated a quote machine to having a slot machine sitting on your desk. You’re going to be inclined to feed it-DON’T! The great thing is that ,there are simple physical restraints to solve micromanagement, overtrading, and simply becoming emotional in the first place. First, turn off your screens if you have to. Set a hard stop or an alert. I’ve been watching this crappy position that I’ve been in for weeks. It hasn’t hit the stop therefor, following my plan, I can’t exit. Every time I look at it, I get angry. Finally, I set an alert and took it off my screen. I forgot about it until I got an alert a few days ago. I then promptly took my lumps and shouted in my best Paul-Giamatti-as-John-Adams voice: “I SAID GOOD DAY, SIR!”

Now, you may be thinking, why not just exit the position instead of waiting for a stop? The problem here is twofold, one, you’re no longer following the plan-you can’t get a little bit pregnant. If you violated one rule, then you’ll likely to violate more and more. You'll become a micromanager, all but ensuring that you’ll never catch a trend. And, second, the market doesn’t always adhere to your schedule. People often email me to tell me that they have exited “dead money” positions. Their reasoning for abandoning the plan is usually well thought, logical, and legitimate. Unfortunately, as Murphy would have it, this is usually right before the stock takes off.
In Summary
It’s cliché, but plan your trade and trade your plan. The planning part is easy. Following it is not. This is because different parts of the brain “take over." Therefore, avoid making emotionally charged mistakes by taking the aforementioned six steps.
Let me know what you think-scroll down and leave a comment.
May the trend be with you!

Dave Landry
Bibliography/References
Maurer, Robert "The Kasien Way"
Faith, Curtis "Trading From The Gut"
Steenbarger, Brett "The Psychology Of Trading"
Watts, Dickerson "Speculation As A Fine Art And Thoughts On Life"
Panic Monster concept borrowed from waitbutwhy.com
*Damasio, Shull


